What is The ImageThink Method™ ?
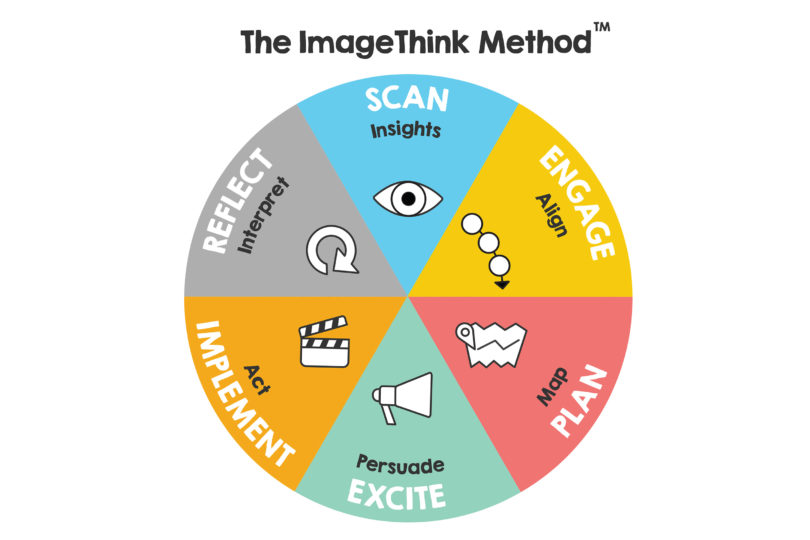
What makes The ImageThink Method™ so special? The same way our Visual Strategists synthesize and re-contextualize ideas visually, our unique methodology fuses behavioral psychology, design thinking principles, and the neuroscience of visual storytelling into a unique framework for leading business transformations large and small.
Ready to change your thinking?
The Six Phases of The ImageThink Method™
Reflect
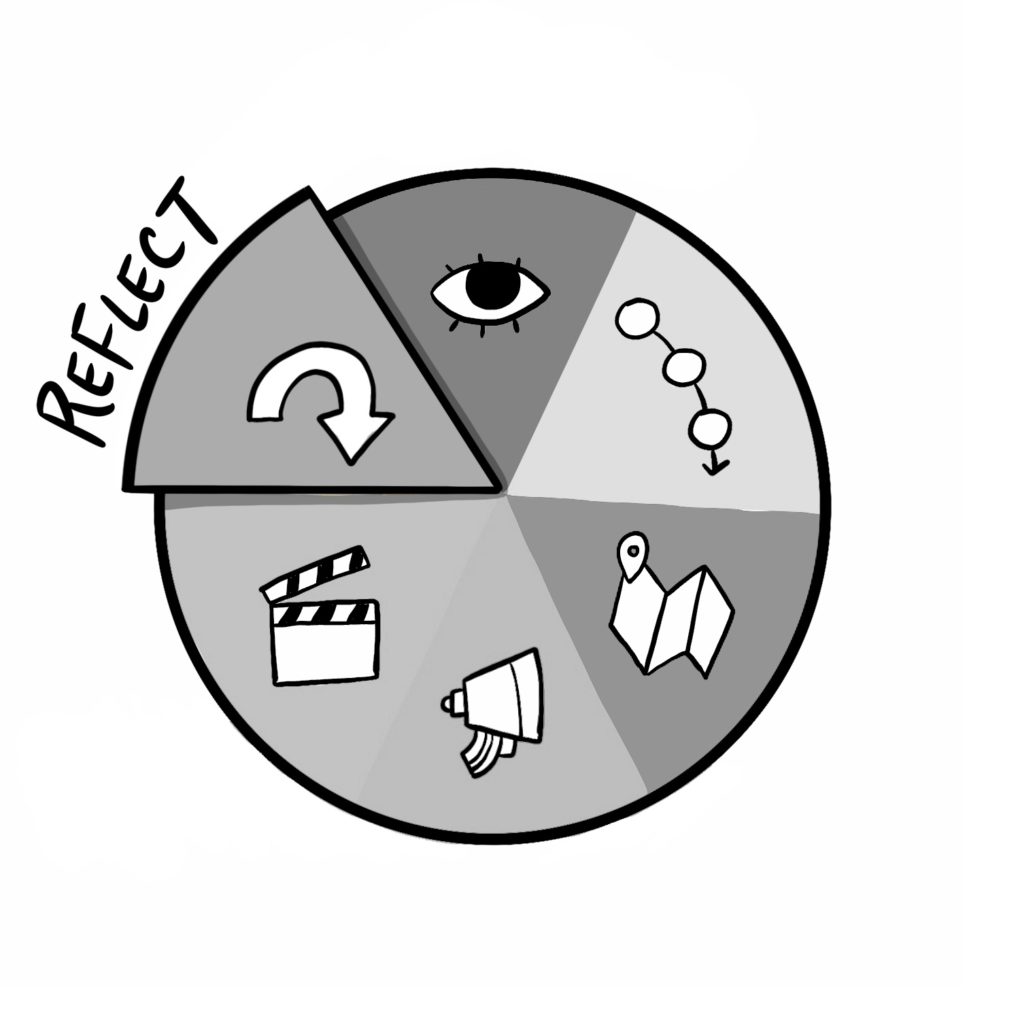
Whether the initiative is a success or loses steam, the REFLECT Phase is the opportunity to review what worked, and what didn’t.
Scan
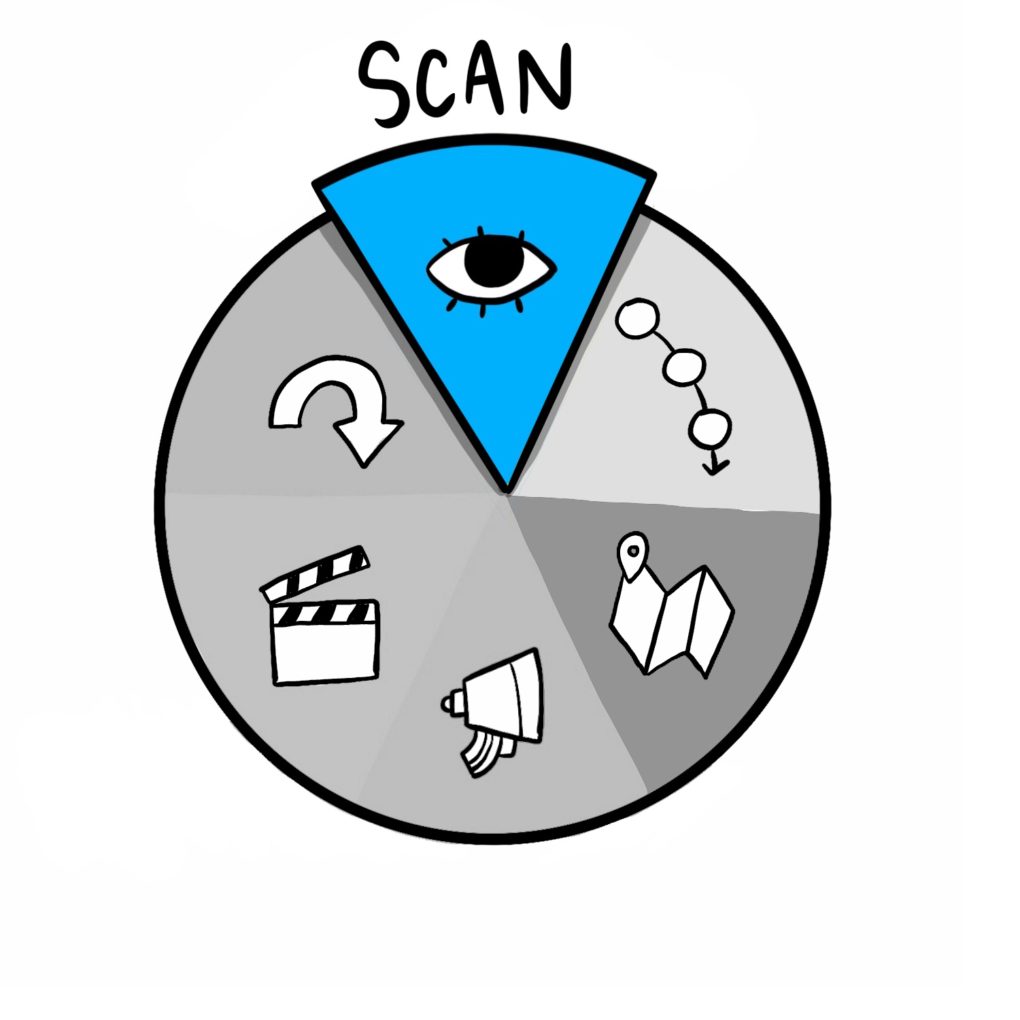
From research to brainstorms, the SCAN Phase gathers information and insights from various perspectives and gets creative juices flowing.
Engage
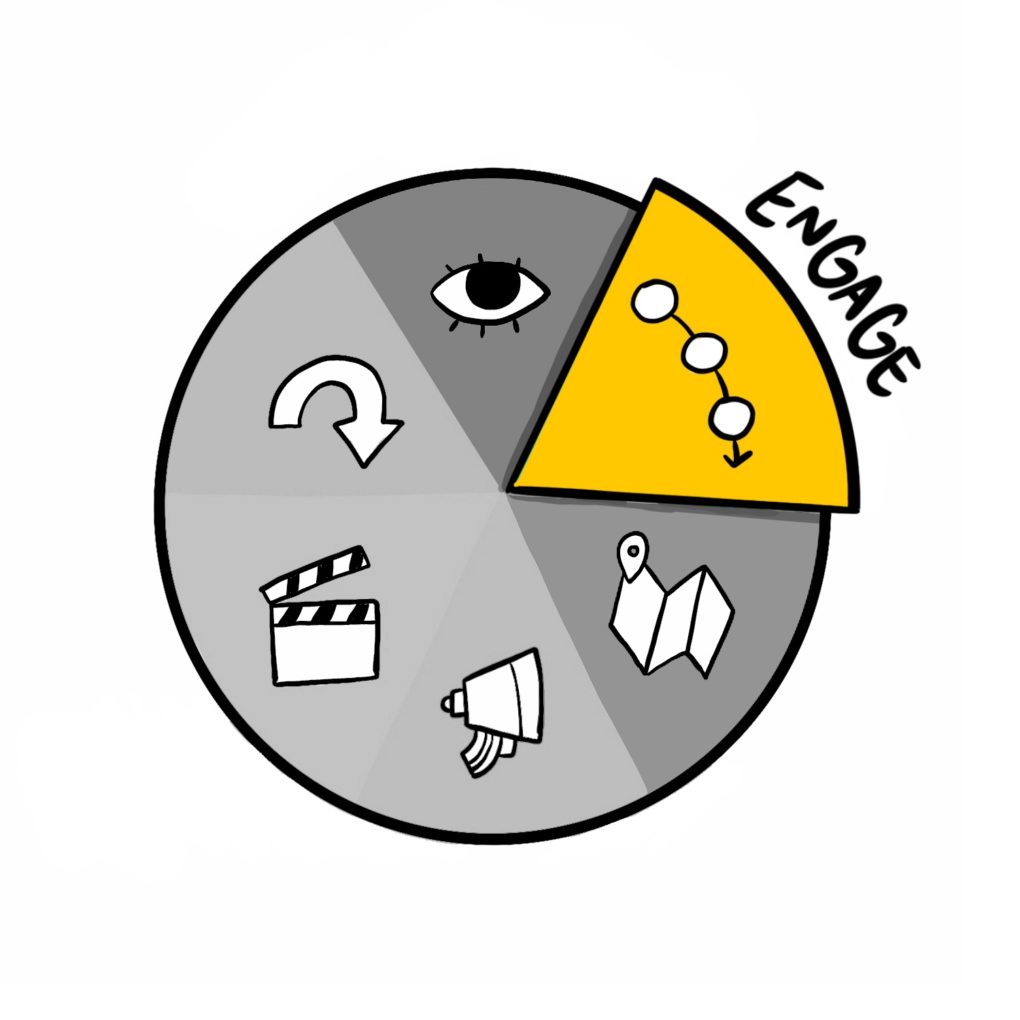
From embracing culture changes to a bold new action plan, the ENGAGE Phase rallies your internal team to active support of your project.
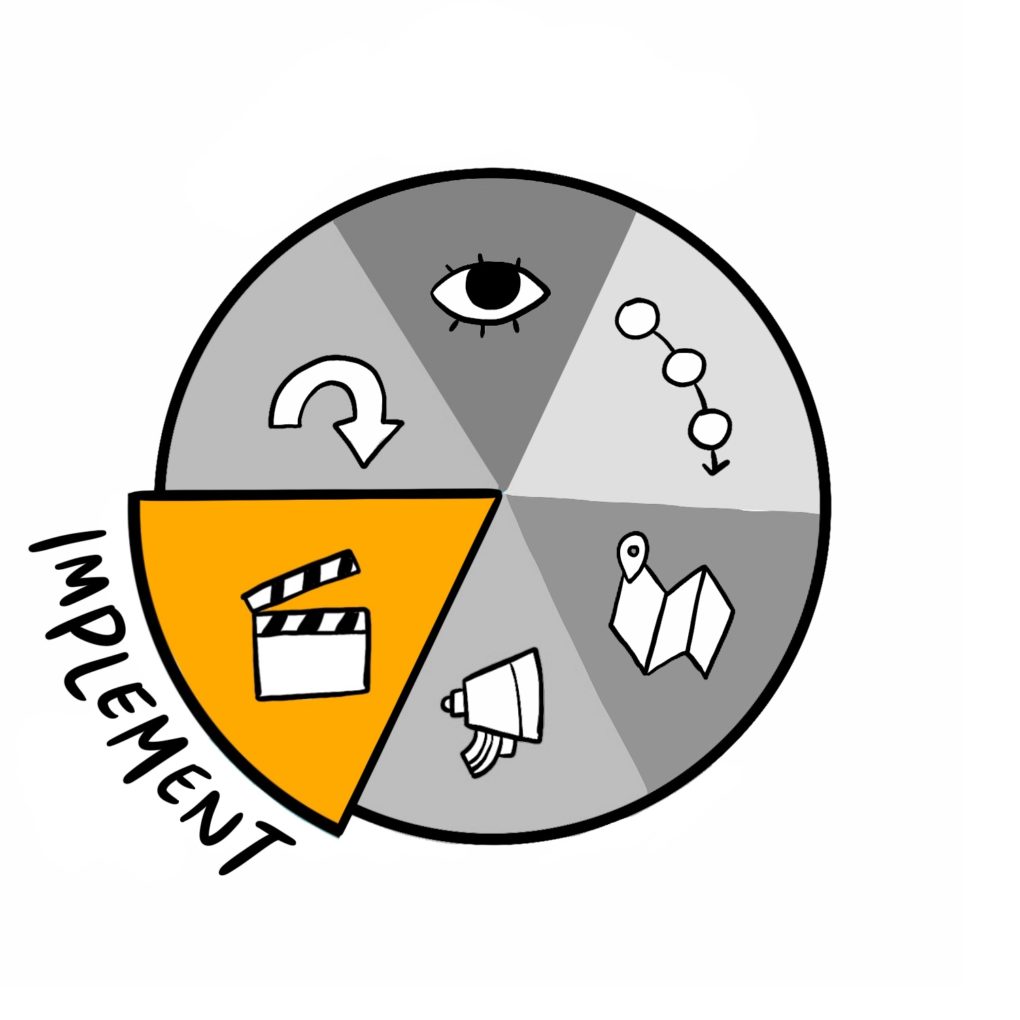
Implement
The rubber meets the road during the IMPLEMENT Phase, when action items are executed and the plan is fully realized.
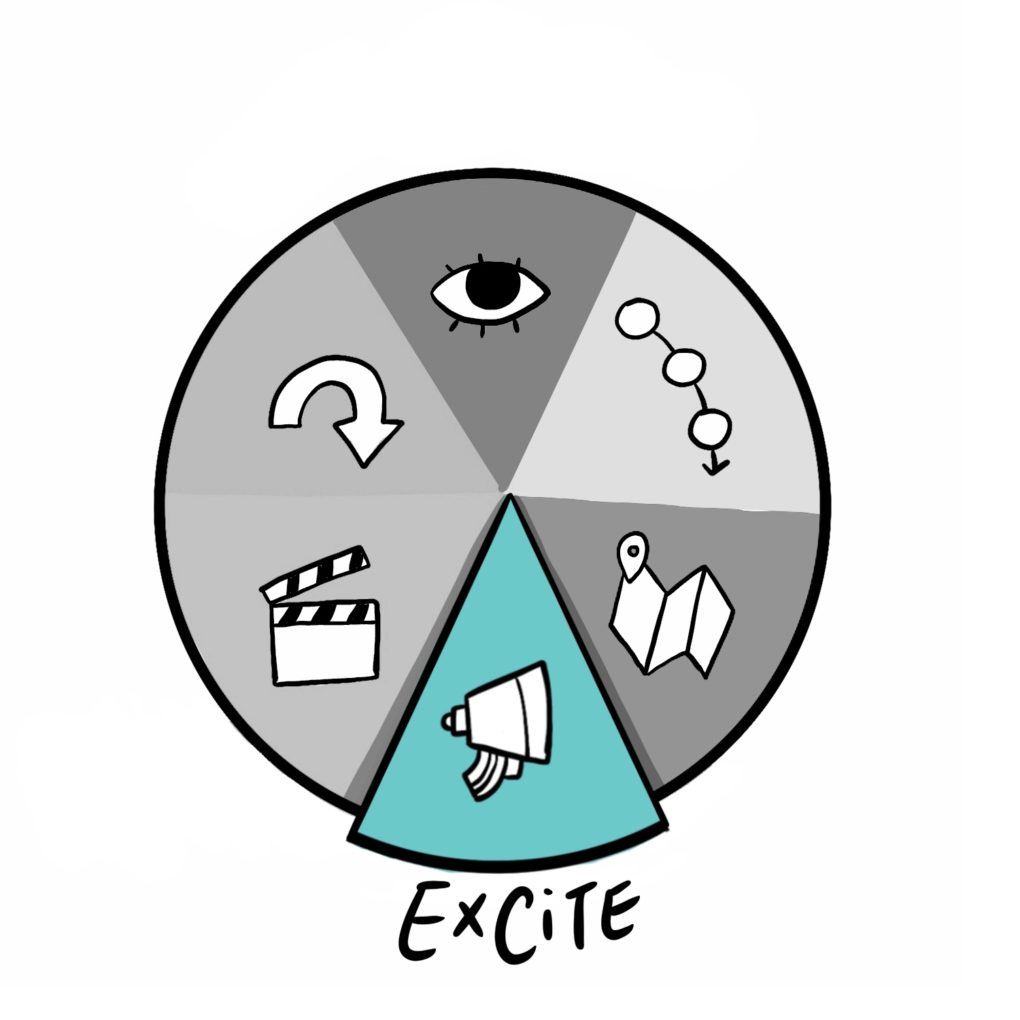
Excite
The EXCITE Phase is the time to share your work with the world, build buzz, and persuade your external audience of your project’s value.
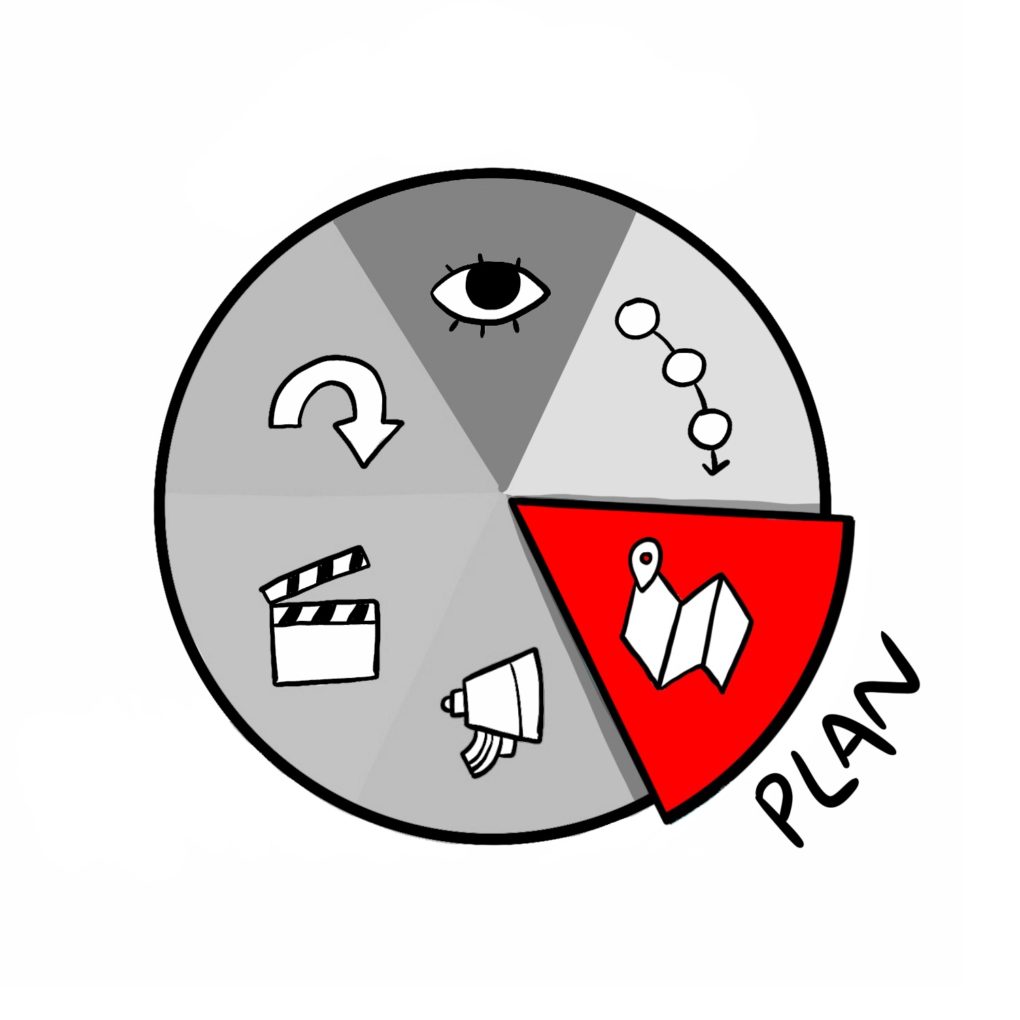
Plan
With your team aligned around a clear vision, the PLAN Phase turns ideas into action with clearly defined action items, due dates, and owners.
Ready to change your thinking?
Origins
Behavioral Psychology
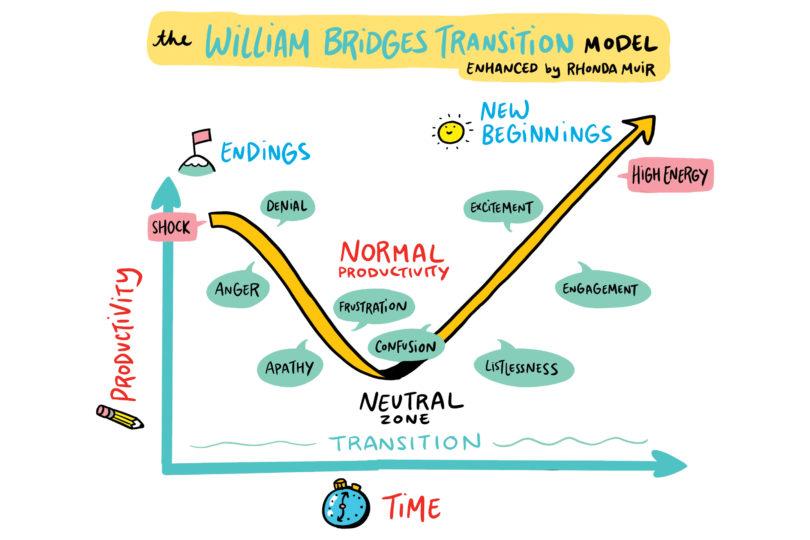
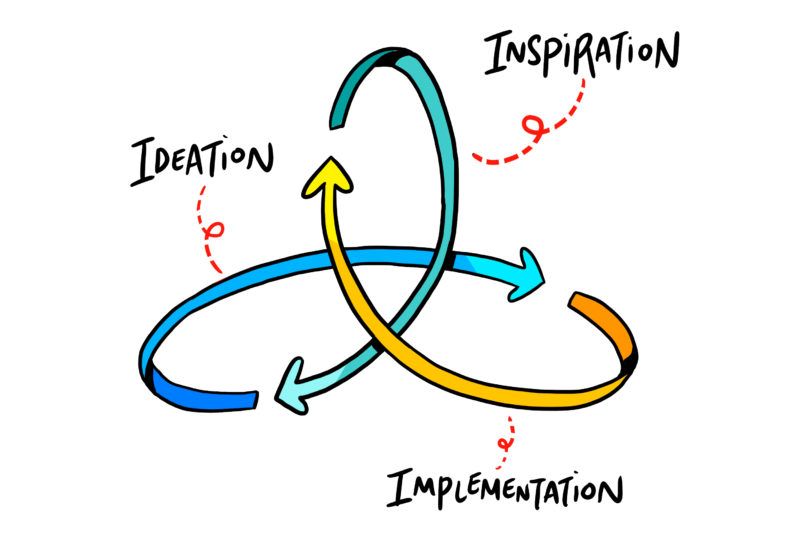
In 1947, Fritz Perls, one of the founders of Gestalt Therapy, developed what he called the Organisimic/World Metabolism, which we now call the Cycle of Experience, as a way to describe how we interact with the world around us. There are seven stages to Perls’ Cycle of Experience, which influence the Phases of The ImageThink Method™.
Design Thinking Principles
In the words of Tim Brown, Executive Chair of IDEO, “Design thinking is a human-centered approach to innovation that draws from the designer’s toolkit to integrate the needs of people, the possibilities of technology, and the requirements for business success.” Importantly, while each stage naturally move forward from one to the next, the entire process is cyclical, repeatable, and regularly involves jumping back to earlier steps with new information and learnings.
Visual Theory
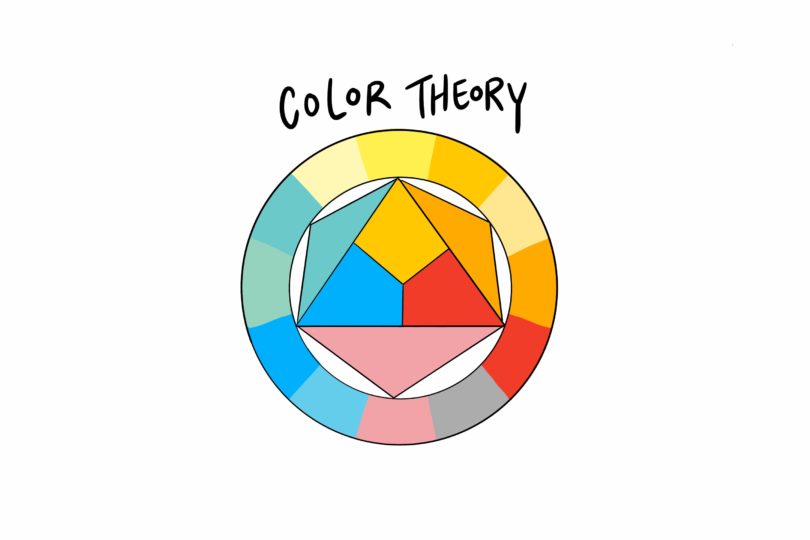
As Visual Strategists and advocates of graphic recording, our proprietary methodology unsurprisingly leans heavily on the science of visuals. We know that 70% of the human brain’s sensory inputs are dedicated to processing visual stimuli, and that we’re hard-wired to anthropomorphize objects as a survival mechanism. Armed with this knowledge, ImageThink applies the tenets of color theory, composition, and typographic hierarchy to produce visual summaries. By leveraging visual mnemonics, we communicate complex ideas with impact.
Ready to change your thinking?
The ImageThink Method™ by the Numbers
Scan Phase: The Value of Gathering Insights
- Businesses that invest in creativity are 83% more likely to foster innovation.
- Businesses that invest in creativity are 73% more likely to be financially successful.
- Creative team members earn on average 13% more than their counterparts. 53% describe themselves as happy, and 39% describe themselves as successful.
- Globally, 76% of respondents to an Adobe study define creativity as key to economic growth.
(source)
Engage Phase: Alignment Helps the Bottom Line
- The earnings per share of companies with highly engaged employees are 2.6x higher.
- Companies in the lowest quartile for employee engagement experience 41% more turnover.
- Companies with highly engaged employees grow 3x faster.
(source)
Plan Phase: Having a Strategy Pays Off
- According to a 1974 HBR study, organizations that leverage data and make strategic plans perform significantly better than those that don’t, both in terms of profit and social impact.
- 63% of companies only plan one year or less in advance.
(source)
Excite Phase: There’s a Small Window to Grab Your Audience
- 81% of people admit that they skim when they read.
- Content (posts, emails, ads) that includes images performs 650% better than text alone.
- In the last 10 years marketing and advertising has grown from accounting for roughly 8% of the annual budget to as much as 12%.
(source)
Reflect Phase: Do It Well, Then Do It Better
- 70% of companies don’t consider non-financial factors in a projects success or failure.
- Those that measure non-financial factors have 1.5x greater returns on equity.
(source)
Ready to Unlock Your Full Potential?
"*" indicates required fields